I recently ran into a use case where I had to horizontaly scale a Kubernetes deployment based on the number of jobs in a particular queue. While the Kubernetes HPA works with works with CPU and memory out of the box, using it with pretty much any any other metric requires you to deploy an entire monitoring solution This, at the time, seemed like a huge hammer for a small nail.
I wanted to see if I can roll out a leaner solution and find a way to make the HPA work with my single, specific metric. This eventually lead me to writing my own external metrics server for Kubernetes, and I decided to make the proof of concept publicly available in case it helps someone with a similar problem. The entire source code can be found on github
The solution is based on the custom-metrics-adapter project found in the kubernetes-incubator. The project is inteded to serve as a library for bootstraping a metrics server, and it proved to be of immense value for understanding how the kubernetes API can be plugged into.
End goal
What I set out to accomplish with this project was to deploy a beanstalkd instance (the simplest possible queue in the world) in Kubernetes, and see how I can use a Horizontal Pod Autoscaler to scale a deployment based on the number of jobs in a particular tube (another name for a single queue).
As an end result, I aimed to:
- Build an external metrics server satisfying the Kubernetes API
- Deploy the metrics server in Kubernetes
- Set up an HPA using the metric from my server
- Observe the HPA in action
Acquiring needed libraries
The kubernetes-incubator/custom-metrics-server already has a lot of boilerplate to begin with, and the good thing is that we can use many of those packages as external dependencies. Instead of cloning the repository and butchering the code inside it, I imported all of the necessary packages as external dependencies. Finally, I made a snapshot of the dependencies and added the vendor folder to git.
Implementing the external metrics server
Once I had the dependencies in place, implementing the actual adapter was quite straightforward. The server object needs to implement a simple interface with two methods:
type ExternalMetricsProvider interface {
    GetExternalMetric(
        namespace string,
        metricSelector labels.Selector,
        info ExternalMetricInfo,
    ) (*external_metrics.ExternalMetricValueList, error)

    ListAllExternalMetrics() []ExternalMetricInfo
}
The implementation of the interface can be found in the server type and is quite straightforward.
All the metrics information is kept in memory and is retrieved from the beanstalkd queue every 5 seconds.
Deploying the external metrics server
Deploying the actual docker image running the server took me a while to figure out, but was also not difficult once I had the boilerplate in place. There are several steps that need to be taken:
- Create a ServiceAccount for our external metrics server
- Assign the
system:auth-delegatorandextension-apiserver-authentication-readerroles to the ServiceAccount - Create a ClusterRole allowing
getandlistrequests to all resources from theexternal.metrics.k8s.ioapi group - Assign the role from the previous step to the ServiceAccount
- Create a deployment with the docker image running our external metrics server, running as the ServiceAccount from step 1.
- Finally, create a service, and expose the service through the
external.metrics.k8s.ioAPI.
The manifests which create these resources can be found here
Testing our work
There is a Makefile in the repository which you can use to perform all necessary steps to build and deploy the metrics server.
The Makefile is made to work with Minikube, but can be easily modified to depoy to a remote cluster.
Run make build to build a docker image with the metrics server, and make deploy to deploy the following resources to Kubernetes:
- The external metrics server
- A beanstalkd instance, together with beanstalkd-console used for gaining web access
- A hello world deployment and an HPA using the number of jobs in the default beanstalkd queue to scale the deployment
If you run kubectl get pods -n external-metrics, you should see one instance of the hello world pod.
Access beanstalkd on $(minikube ip):30001 and add a few jobs to the default queue. After a few seconds you will see the number of pods from the hello world deployment go up. The HPA is configured to spin up one pod for every 2 jobs in the queue.
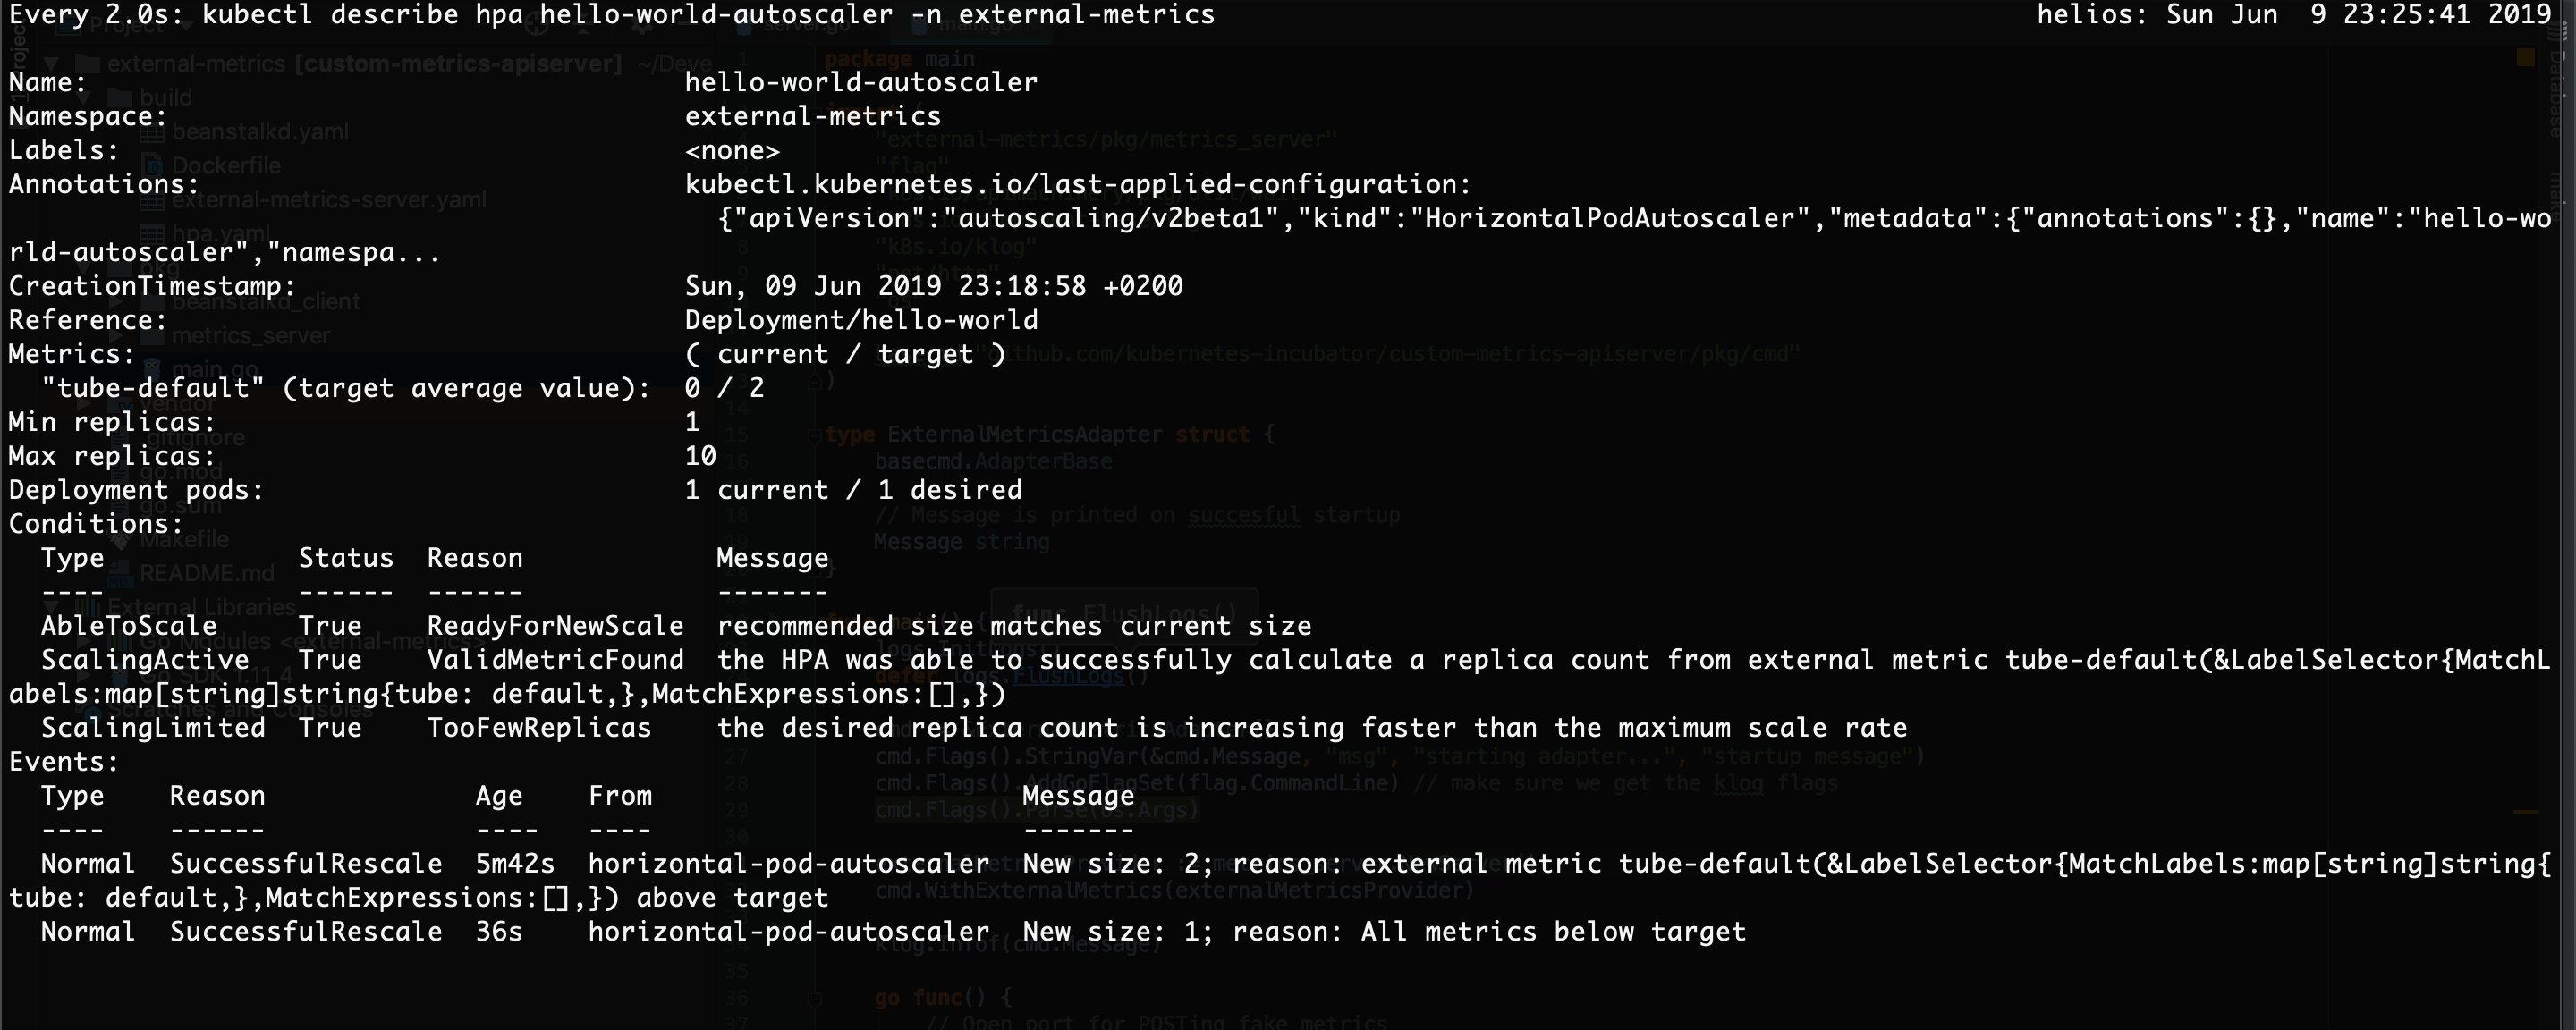
You can also gain insight into the HPA by running kubectl describe hpa hello-world-autoscaler -n external-metrics. You can see all of the scaling events, the number of desired pods and the number of current pods. Play around by adding and removing jobs from the queue, and see the scaling in action. You need to be aware that the Kubernetes HPA will scale up much quickly than it will scale down. This is by design, in order to smooth out the response to a potentially fluctuating metrics. In addition, the HPA tries to be cautious and will keep the number of pods up for a while even when the metric value goes down, in anticipation of a potential immintent increase of the value.

Wrap up
That’s all folks. I hope this project will teach how metrics servers and the HPA interact you as much as it has taught me. Please leave a comment or any type of feedback (positive or negative) if you found this article useful, and feel free to connect in any way :)
